Portfolio_Kiran
Project 1 : Excel Pivot & Dashboard
Project Overview :
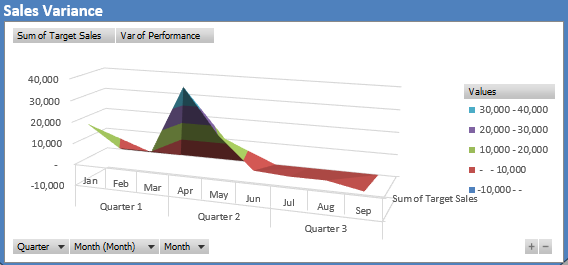
This project developed an interactive dashboard to track and analyze key sales and profitability metrics, leveraging structured pivot tables and dynamic visualizations. Using monthly, quarterly, and regional breakdowns, the dashboard provides insights into sales performance, profit trends, customer engagement, and target achievement. It empowers decision-makers with actionable insights to optimize strategies and improve overall business performance (KPI).
- Comprehensive Analysis: Utilized pivot tables to summarize data by months, regions, and quarters, tracking metrics like sales, profit, and customer engagement.
- Dynamic Visualizations: Created charts, including bar and line graphs, to visualize trends, compare actual vs. target performance, and highlight regional differences.
- Actionable Insights: Identified performance gaps and seasonal trends to enhance strategic planning and improve target achievement rates.

| For further details please visit the documentation | For viewing actual worksheet please visit OneDrive |
Project 2 : SQL-Tableau Dashboard
Project Overview :
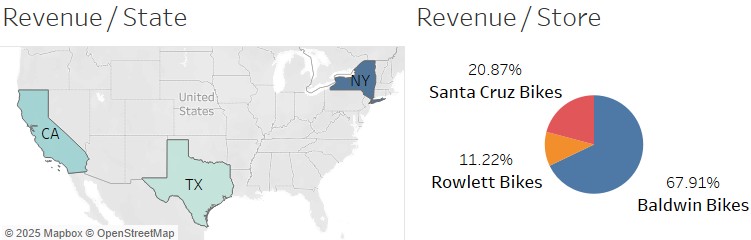
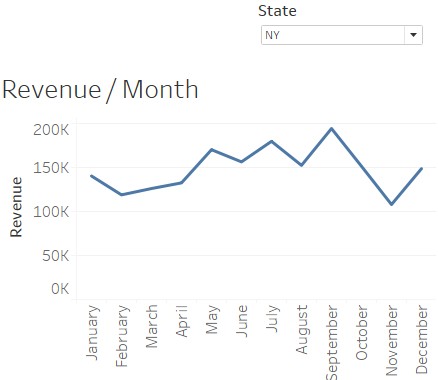
The primary goal of this project was to provide clear and actionable insights into revenue trends and performance metrics across various dimensions, such as time, location, and product categories.
This project demonstrated the integration of SQL and Tableau to create an end-to-end data visualization solution that transformed raw sales data into actionable insights. The process involved meticulous data preparation, including normalization and aggregation in SQL, followed by advanced visualizations and an interactive dashboard in Tableau. The solution highlights trends in revenue, identifies top-performing dimensions like states, stores, and product categories, and empowers stakeholders with intuitive, data-driven decision-making tools.
- Created an end-to-end data visualization pipeline using SQL for data preparation and Tableau for interactive dashboard development.
- Provided actionable insights on revenue trends, top-performing locations, and product categories through advanced visualizations like bar charts, maps, and heatmaps.
- Addressed challenges in data normalization, performance optimization, and dashboard design to ensure a robust and user-friendly solution.
| For further details please visit the documentation | For Tableua please follow the link |
Project 3 : Amazon Quicksight (AWS Cloud) Visualization
Project Overview :
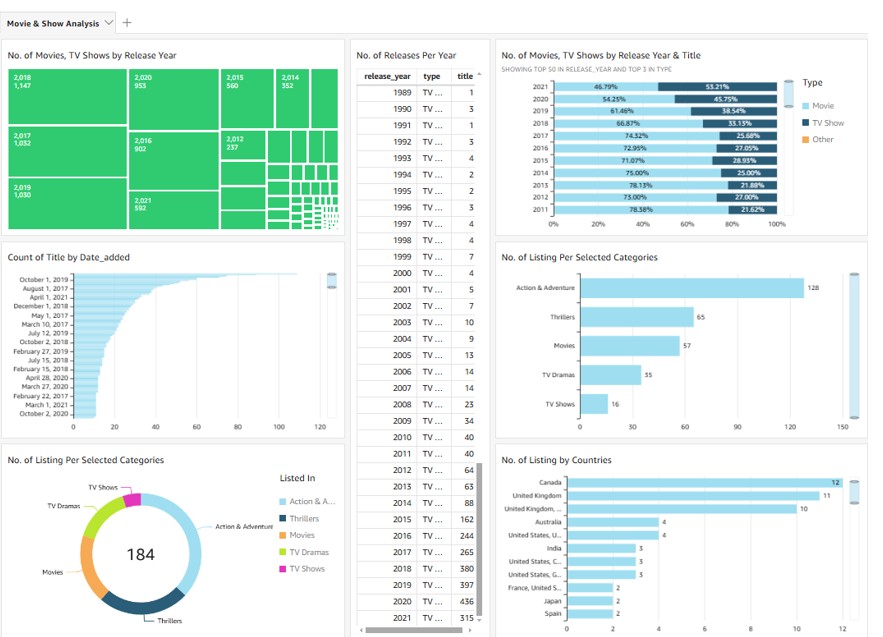
This project involved analyzing Netflix movie and TV show production data (show_id, title, director, cast, etc.) from 2007 to 2021 by utilizing Amazon QuickSight for data visualization. The process included loading data into an S3 bucket, connecting it to QuickSight, and creating a comprehensive dashboard for visual analysis, enabling better insights into trends and patterns in Netflix’s content library.
- Utilized S3 and QuickSight for efficient data integration and visualization.
- Created dynamic dashboards with a variety of visualization types and applied filters for deeper analysis.
- Enhanced decision-making through the ability to export, share, and collaborate on dashboards.

For further details please visit the documentation
Project 4 : SQL Database & Reporting
Project Overview :
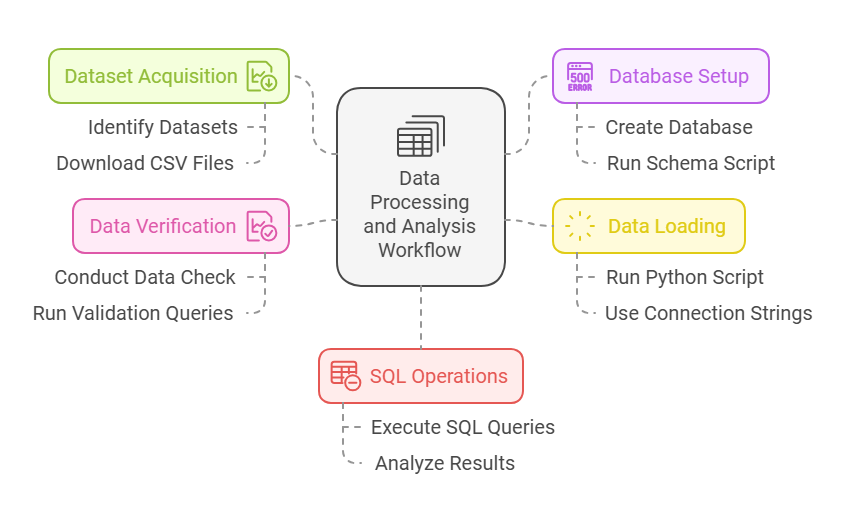
This project involved leveraging SQL and Python to analyze a rich dataset on paintings, artists, and museums. By loading the data into a MySQL database and executing targeted SQL queries, we answered key business questions regarding museum operations, artist popularity, canvas pricing, and painting styles. The insights obtained provide actionable information on global art trends and operational details of museums.
- Conducted data extraction, transformation, and loading (ETL) for 8 datasets into a MySQL database, resolving foreign key constraints.
- Answered 14 key business questions, revealing insights on artist popularity, museum operations, and painting trends.
- Delivered insights such as the most expensive canvas size, the longest-operating museums, and artists with global reach.

For further details please visit the documentation
Project 5 : Python-Streamlit Web Application
Project Overview :
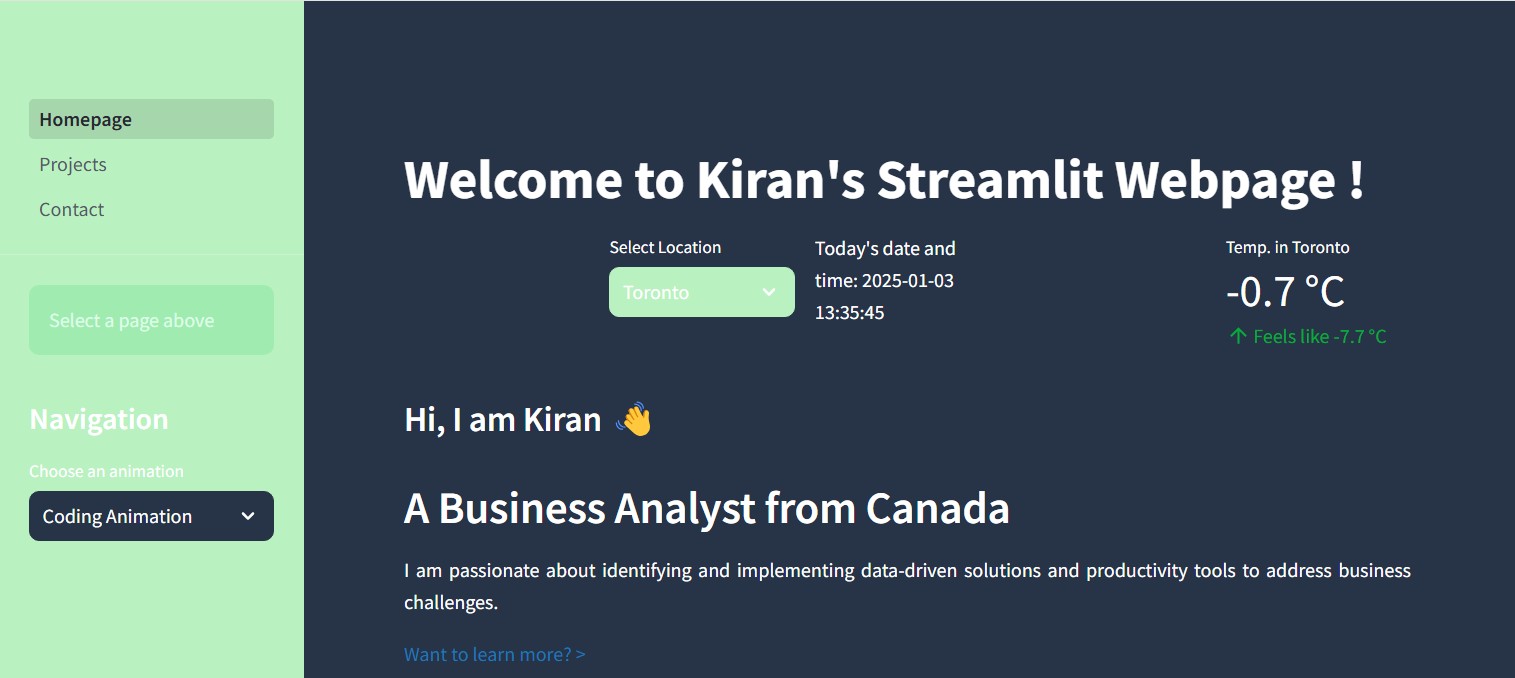
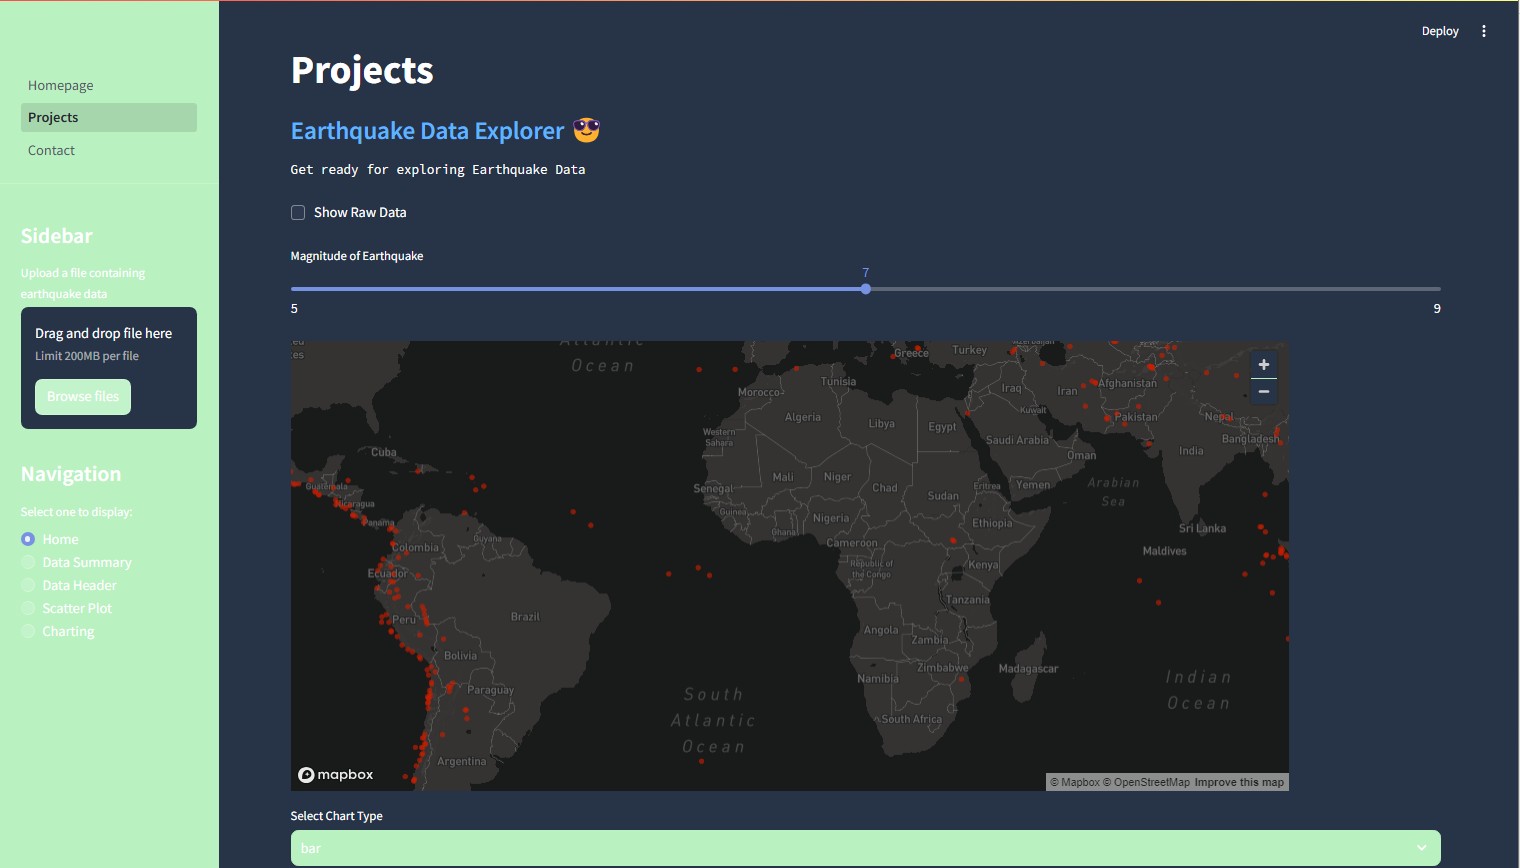
This Streamlit-based web application is designed to showcase interactive data visualization and analysis tools. The platform allows users to upload earthquake-related CSV files, explore dataset summaries, and generate insightful visualizations such as scatter plots, geographic maps, and statistical summaries. Its intuitive design enhances data accessibility and provides meaningful insights for decision-making.
- Enables seamless CSV file uploads for earthquake-related data exploration.
- Offers dynamic visualizations, including scatter plots, geographical maps, and statistical summaries.
- Designed for ease of use, with a navigation menu for interactive data exploration.
For further details please visit the documentation | For viewing the app